.. a 28% reduction in loos since 2000
April 26, 2016 at 4:33 pm 4 comments
“A 28% reduction in public toilets since 2000, in England and Wales.”
That’s my headline, now an explanation of all the data and assumptions that lead me to it.
Public toilets are subject to business rates, so the valuation office agency has details on all public toilets along with their rateable value. This was recently mentioned in a regular toilet-enthusiasts email conversation, along with the suggestion of using the data to calculate the number of closures, after the Prime Minister said in 2015 that he’d look into exempting public toilets from business rates to save them from closure.
Where’s the data from?
I’ve collated valuation office agency figures from 2000, 2002, 2003, 2004, 2008, 2012 and 2016.
The figures for 2000 and 2002-2004 were recorded in Hansard in 2005.
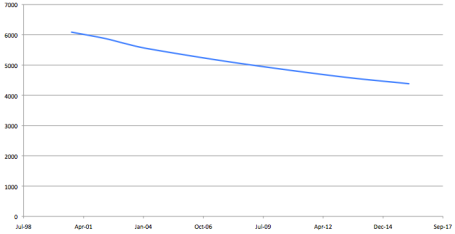
- 2000: 6087 toilets
- 2002: 5882 toilets
- 2003: 5701 toilets
- 2004: 5539 toilets
[analysis of provisional Valuation Office Agency Data. Data as at 1 October 2000, and 1 April for 2002, 2003 and 2004]
The figure for 2008 is given in a Parliamentary Question from 2008.
- 2008: 5084 toilets (30 Jan 2008)
The data for 2012 I received in an email from another toilet enthusiast.
- 2012: 4626 toilets (Dec 2012)
The data from 2016 I copy/pasted into Excel from 107 pages of Valuation Office Agency search results (fun times).
- 2016: 4383 toilets (March 2016)
From the 2016 data, as I had the full dataset rather than just the total number, I could interrogate the data. I deleted any results that were themselves listed as ‘deleted’ in the rateable value column rather than as a value (which I’d assume the figures for other years also do; certainly the 2012 data does not include any toilets marked ‘deleted’). Even then, there are toilets listed as ‘under reconstruction’, ‘derelict’, ‘closed’; however these are relatively few (~40) once the ‘deleted’ data is removed.
Here’s an ugly graph of the data showing the 28% decline between 2000-2016:
What does the data include?
The Valuation Office Agency rating manual for ‘public conveniences’ states this relates to “all types of public convenience provide for use by the general public (with or without payment). For the avoidance of doubt it is not relevant to the valuation of public toilets forming part of larger hereditaments.”
Rateable values are also applied to automatic public conveniences (‘superloos’) and free-standing urinals – although there’s only 1 urinal listed in the 2016 data.
So how many of England and Wales ‘public’ toilets are included?
Certainly community toilet schemes are not, nor are supermarkets or department stores, or train or tube stations (except Green Park, oddly). It does include some bus stations, but not others.
Where I live in Walthamstow (E17) it lists toilets in the shopping precinct (there are actually two sets but listed as one) and toilets at a suburban station that I’m not aware exist, but it doesn’t include the bus station or park, let alone the library, museum or community toilet scheme. Where I used to live in Battersea (SW11) it doesn’t list any, but again there are three sets of toilets in Battersea Park and at least one set in a cemetery, as well as libraries, department stores, train stations..
So it’s tricky to say how far away this is the absolute value for ‘public’ toilets. More expertise would also been needed (from the valuation office agency themselves perhaps) to know for certain how the previous years’ figures were compiled to be sure they are comparable to 2012 and 2016. What it does show very clearly (assuming definitions have not significantly changed) is that public toilets have significantly declined.
Other sources of data
The 2008 Communities and Local Government Select Committee Report, The Provision of Public Toilets, states that ‘Valuation Office Agency data on the number of toilets with a rateable value shows a decrease from 5,410 toilets in 2000 to 4,423 in 2008, a reduction of 987 or 16 per cent.’
Although it is not stated, this data must be for England only, in which case it’s not too far off the numbers given for Jan 2000 in Hansard (5342 for England alone).
The same report also states the number of toilets listed in the Ordnance Survey Points of Interest database. ‘This identifies around 9,800 public toilets in England in 2007. These are public toilets that are visible from outside, so do not include public toilets inside buildings such as train stations or shopping centres’ It also points out that disabled toilets are exempt from business rates.
For more toilet statistics and dubious analysis, take a look at blog posts on ‘the 40% decline in public toilets’ and ‘the 5000 toilets of England and Wales’.
Entry filed under: Uncategorized. Tags: Central Government, Maps, Public Toilets.
4 Comments Add your own
Leave a comment
Trackback this post | Subscribe to the comments via RSS Feed


1. Michelle Barkley | April 26, 2016 at 4:39 pm
Very valuable data Gail. Thanks for all your hard work in extracting it from data.
2. Gillian Kemp | May 10, 2016 at 9:27 am
Very useful information Gail and in a format that is easy to understand! Many thanks
3. ..the BBC’s new toilet data | Public Toilets and ... | May 31, 2016 at 9:59 am
[…] for England and Wales, which lists how many toilets are eligible for business rates each year, where I found a 28% reduction in public toilets since 2000. The BBC data says 1782 toilets have closed in the UK since 2006. I have numbers from the Valuation […]
4. … business rates. | Public Toilets and ... | November 5, 2018 at 12:01 pm
[…] So in 2016 I found a 28% reduction in public toilets since 2000, in England & Wales. […]