… business rates.
A blog post inspired by the recent Budget announcement that public toilets will no longer pay business rates, official (vague) details of which can be found Business Rates briefing paper – House of Commons library…
From a previous Factsheet from Jan 2017, it seems local authorities could already choose to exempt a privately-owned ‘public convenience’ from business rates, but not a publicly-owned public convenience – meaning their own, or ones devolved to parish/community/town councils.
That’s quite useful, as more and more borough councils are asking these smaller councils to take on the public toilets or see them close. Then asking them to pay business rates on these toilets (£3000 on average, see later on) is a hefty cost to bear.
This reminded me to try to update my records of ‘how many public toilets have closed’ based on VOA data, because this is the only official data source of ‘# of public toilets’ that exists, and can be tracked back to 2000.
So in 2016 I found a 28% reduction in public toilets since 2000, in England & Wales.
That’s now: 32% of public toilets in England & Wales have closed since 2000, as of March 2018.
To recap:
In 2000 there were 6087 toilets (source: Hansard)
By 2016 there were 4383 toilets (source: VOA search results for ‘public conveniences’, with results that returned rateable value: ‘deleted’ removed).
So using their new search site – which the response to my FOI request signposted me to – I did an advanced search of Special Category Code – 224: Public Conveniences (National Scheme). I didn’t copy/paste these into Excel as the website showed 173 pages of results, a fact unhelpfully omitted 2 years ago when I did copy/paste the 2016 data. That was fun.
But in these 173 pages were 4316 results. Some of these (maybe 1 or 2 per page of 25 results) are listed as ‘deleted’ or occasionally ‘disused’ or ‘under reconstruction’. Unfortunately as I’m unable to download the results without API knowledge, I can’t easily edit these out.
So instead, I looked at the downloadable-in-Excel dataset called ‘Non-domesting rating: stock of properties 2018’. This gives headline figures for ‘Cat-Code 224 Public Conveniences’ as follows:
224-Public Conveniences (National Scheme) – England & Wales (31st March 2018)
- Rateable properties (count): 4150
- Rateable value: £13 534 000
- Average rateable value: £3000
As this count of 4150 public conveniences is significantly lower than the 4316 toilets returned in today’s search results, and both are from 2018, this must be the same data with the ‘deleted’ results removed – and at least broadly consistent with data returned in 2000 and subsequent years, in that I also only had headline data and not the full results to interrogate.
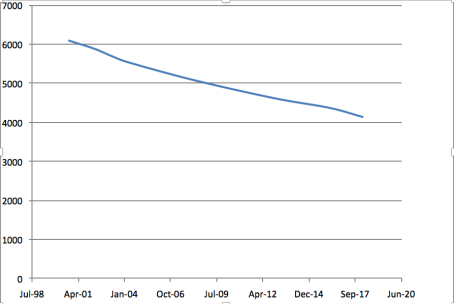
Number of Public toilets in England & Wales, from Valuation Office Agency data, updated for 2018: The downwards trend continues.
So that’s how I’ve arrived at the statement that 32% of public toilets in England & Wales have closed since 2000 (as of March 2018), and 5% have closed in the last 2 years (March 2016 – March 2018).
I *think* that’s an annual decrease of 2.1%,
or
128 public toilets closing every year.
..the BBC’s new toilet data
2018 UPDATE: Since I wrote this the BBC have done another analysis of the UK’s public toilets, again using FOI requests. It is much more thorough, recognising that if a council no longer runs a public toilet that may not mean that the toilet has shut – it might just have been devolved to a parish or town council, or another organisation or community group instead: Reality Check: Public toilets mapped.
——————————-
BBC Breakfast reported today that 1782 toilets had closed in the UK in the last decade, based on their FOI requests.
Data from 331 out of 435 councils also showed
- 10 councils have no council-run toilets (Newcastle, Merthyr Tidfil, Wandsworth..)
- 22 councils have only one (Manchester, Stockport, Tamworth..)
- Highland Council has 127, Pembroke 73, Cornwall 65.
- 4/5 councils have cut expenditure since 2011, with £21 million less spent in total (a reduction of 1/3)
- 43 councils have reduced their budgets by more than 70%.
It’s very exciting to see data produced on toilet closures, considering the scale and importance of the issue. This up-to-date information is so useful when it comes to campaigning for better access to toilets.
I’m particularly obsessed interested in the data itself, particularly its accuracy, and what it says about the accuracy of other sources out there. So how does this data compare with our own analysis, over the years?
- In 2014 we found 8 councils providing no council-run toilets from our FOI requests: Copeland, Hambleton, Bolsover, Shropshire, Breckland, North-east Derbyshire , North Dorset and Tewkesbury. Regarding those picked out by BBC Breakfast as not having any toilets: in 2014 Newcastle then listed 7 on their website, Merthyr Tidfil had 8 (via our FOI) and Wandsworth still had their Community Toilet Scheme of 70+ facilities.
- Our top three were Gwynedd (121 toilets), Highland (111 toilets) and City of London (92 toilets). Gwynedd and City of London both have Community Toilet Schemes within these numbers, which would account for their failure to make the BBC top 3.
- We only consider there to be 406 or 407 councils at the tier of local government that is responsible for public toilets, not the 435 reported above which refers to all UK councils; county councils are not relevant. Nit-picking, yes, however, parish and community councils are stepping in more and more, so this issue is set to become massively more complicated. It’s unclear whether this would be picked up in the BBC data – a toilet that is no longer run by the district council would appear as a reduction in council-run facilities, so would this be therefore a ‘closure’, even if the community or parish council was now running it?
- In terms of closures, the best data we’ve had so far came from using the Valuation Office Data for England and Wales, which lists how many toilets are eligible for business rates each year, where I found a 28% reduction in public toilets since 2000. The BBC data says 1782 toilets have closed in the UK since 2006. I have numbers from the Valuation Office Agency from 2004 and 2008 but not 2006; these show a reduction in numbers of 1156 toilets and 701 toilets respectively. However, consider that the VOA data doesn’t include Scotland or Northern Ireland. There’s also not an exact correlation between ‘council-run public toilets’ in the BBC’s report and ‘public conveniences subject to business rates’ in the VOA data. Whichever definition is used, we’ll still end up with a figure north of 1000 toilets closed in 10 years for the whole of the UK.
So, all in all we now have multiple sources of data about public toilets that seem to support each other and stand up to some gentle scrutiny. Thank you BBC for this latest report.
.. a 28% reduction in loos since 2000
“A 28% reduction in public toilets since 2000, in England and Wales.”
That’s my headline, now an explanation of all the data and assumptions that lead me to it.
Public toilets are subject to business rates, so the valuation office agency has details on all public toilets along with their rateable value. This was recently mentioned in a regular toilet-enthusiasts email conversation, along with the suggestion of using the data to calculate the number of closures, after the Prime Minister said in 2015 that he’d look into exempting public toilets from business rates to save them from closure.
Where’s the data from?
I’ve collated valuation office agency figures from 2000, 2002, 2003, 2004, 2008, 2012 and 2016.
The figures for 2000 and 2002-2004 were recorded in Hansard in 2005.
- 2000: 6087 toilets
- 2002: 5882 toilets
- 2003: 5701 toilets
- 2004: 5539 toilets
[analysis of provisional Valuation Office Agency Data. Data as at 1 October 2000, and 1 April for 2002, 2003 and 2004]
The figure for 2008 is given in a Parliamentary Question from 2008.
- 2008: 5084 toilets (30 Jan 2008)
The data for 2012 I received in an email from another toilet enthusiast.
- 2012: 4626 toilets (Dec 2012)
The data from 2016 I copy/pasted into Excel from 107 pages of Valuation Office Agency search results (fun times).
- 2016: 4383 toilets (March 2016)
From the 2016 data, as I had the full dataset rather than just the total number, I could interrogate the data. I deleted any results that were themselves listed as ‘deleted’ in the rateable value column rather than as a value (which I’d assume the figures for other years also do; certainly the 2012 data does not include any toilets marked ‘deleted’). Even then, there are toilets listed as ‘under reconstruction’, ‘derelict’, ‘closed’; however these are relatively few (~40) once the ‘deleted’ data is removed.
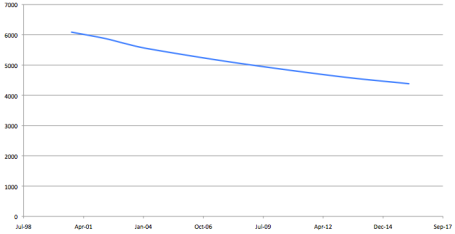
Here’s an ugly graph of the data showing the 28% decline between 2000-2016:
What does the data include?
The Valuation Office Agency rating manual for ‘public conveniences’ states this relates to “all types of public convenience provide for use by the general public (with or without payment). For the avoidance of doubt it is not relevant to the valuation of public toilets forming part of larger hereditaments.”
Rateable values are also applied to automatic public conveniences (‘superloos’) and free-standing urinals – although there’s only 1 urinal listed in the 2016 data.
So how many of England and Wales ‘public’ toilets are included?
Certainly community toilet schemes are not, nor are supermarkets or department stores, or train or tube stations (except Green Park, oddly). It does include some bus stations, but not others.
Where I live in Walthamstow (E17) it lists toilets in the shopping precinct (there are actually two sets but listed as one) and toilets at a suburban station that I’m not aware exist, but it doesn’t include the bus station or park, let alone the library, museum or community toilet scheme. Where I used to live in Battersea (SW11) it doesn’t list any, but again there are three sets of toilets in Battersea Park and at least one set in a cemetery, as well as libraries, department stores, train stations..
So it’s tricky to say how far away this is the absolute value for ‘public’ toilets. More expertise would also been needed (from the valuation office agency themselves perhaps) to know for certain how the previous years’ figures were compiled to be sure they are comparable to 2012 and 2016. What it does show very clearly (assuming definitions have not significantly changed) is that public toilets have significantly declined.
Other sources of data
The 2008 Communities and Local Government Select Committee Report, The Provision of Public Toilets, states that ‘Valuation Office Agency data on the number of toilets with a rateable value shows a decrease from 5,410 toilets in 2000 to 4,423 in 2008, a reduction of 987 or 16 per cent.’
Although it is not stated, this data must be for England only, in which case it’s not too far off the numbers given for Jan 2000 in Hansard (5342 for England alone).
The same report also states the number of toilets listed in the Ordnance Survey Points of Interest database. ‘This identifies around 9,800 public toilets in England in 2007. These are public toilets that are visible from outside, so do not include public toilets inside buildings such as train stations or shopping centres’ It also points out that disabled toilets are exempt from business rates.
For more toilet statistics and dubious analysis, take a look at blog posts on ‘the 40% decline in public toilets’ and ‘the 5000 toilets of England and Wales’.
…the magic of open data
I’m so annoyed.. or elated.. I’m not sure.
I just made a fully-functioning Toilet Map for England & Wales in just over an hour.
Click the image to try out this map of 1611 loos:
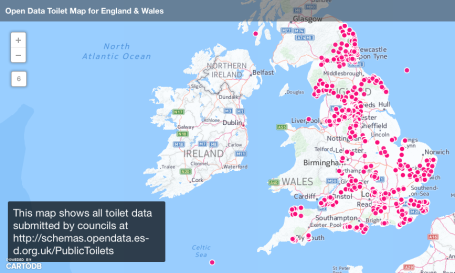
©2015 HERE Terms of use CartoDB attribution
This is because over 80 of the 406 councils responsible for toilets now publish public toilet open data, thanks to the Local Government Association (LGA) Local Government Open Data Incentive Scheme, open to councils in England & Wales.
By developing a standard, the toilet data contains extra details that people need to meet their needs (open, accessible to them, attended, free, etc..). It also means it’s incredibly easy to use the data, as it can all be combined into 1 dataset from 80+.
To put this map in context:
The first toilet map I made, in 2010, was a Google Map of 56 Public and Community Toilets in Wandsworth. It took me 5 hours and a trip to a cemetery.
The second, The Great British Public Toilet Map of 10000 toilets, has taken 3.5 years (so far), several thousand pounds, and the combined effort of developers, enthusiasts and hundreds of members of public.
The map above I made with no skill whatsoever:
- I downloaded the .csv file containing all the data from http://schemas.opendata.esd.org.uk/PublicToilets (by clicking the ‘1’ at the bottom of the page).
- I opened this in Excel and went ‘ooo!’.
- I then uploaded the dataset to CartoDB using a free trial.
- I clicked ‘View map’ and selected the 2 columns containing the Latitude and Longitude infomation from a drop-down list.
THAT’S IT.
That didn’t take an hour. That took about 10 minutes. However it only showed a few hundred toilets, yet there were over a thousand rows of info in the .csv file.
On closer inspection, I found that the Lat & Long columns were a mix of Lat / Long and Northings/Eastings. So for those toilets that had the latter, I pasted the Northings/Eastings into a different column. I then found a site to convert them by googling ‘convert northings eastings into lat long’ – I used gridreferencefinder.com. I don’t know how accurate this is, but it wouldn’t be much work to use the Ordnance Survey’s own converter instead. I then used a VLookup function in Excel to enter in the corresponding Lat/Long for each Northing/Easting. I was quite pleased with this, but I could have used Copy/Paste.
I then uploaded this dataset, tided up the new map using the nice CartoDB interface and picked out which details would be shown when you click on each toilet. I’m still reeling at how easy it is.
Now, The Great British Public Toilet Map has 10000 toilets, 10 x the amount shown on this map, or listed on the LGA site and data.gov.uk.
This just serves to show the potential of more councils, and other providers (train stations, service stations, shopping centres) joining up to publish standard public toilet open data (or any open data), that could help the public or improve a public service, especially for those that need them most.
…mapping public toilets by council
There are 406 councils in the UK responsible for public toilets. We collected information on nearly all of them, either through their website information or through nearly 300 FOI requests to councils for The Great British Public Toilet Map. In January I coloured-in a map of the UK to show toilets per council.

On Thursday I went to a Visualising Data workshop run by the Future Cities Catapult. They gave lots of advice on presenting data and using it to tell stories. For example, it’s important to choose the range of colours carefully so that it’s clear what you’re trying to convey, by using sites like colorbrewer2.org (as opposed to using whatever felt pens you can find in the office, see image 1).
They also proposed that just because you can present location data on a map, that doesn’t mean it’s necessarily the best way. This is definitely something to take on board, but not before I figure out how to make the above map digitally.
So I’ve used CartoDB to do just that. The interactive version, with useful things like Titles! and Keys! is here: http://cdb.io/1HuiPn0. Meanwhile, here are still images.
(note: I’ve not included councils that have no toilets. This also includes some councils that do have toilets but didn’t give any data and we didn’t seek to count London councils at the time, so they are also blank. Also the free trial of CartoDB only allowed 50MB of data which wasn’t enough to import council boundaries for the whole UK, so this is just England & Wales :( )
First, I’ve remapped toilets per council:

…which is a lot clearer.
Then, because it’s digital I could replot the data instantly and try other things relating to population and area. Toggling between toilets and population showed that broadly, councils with more people have more toilets. It also highlighted areas that are exceptions – noteably the national parks and seaside resorts – loads of toilets and very few people.
This also shows one of the limits, because toilets aren’t necessarily needed so much for residents but for visitors as well.
There are still exceptions. this map of people per toilet shows the huge range – from just 315 people/toilet (Isles of Scilly) to over 200K people sharing 1 public toilet (Solihull).

I don’t know what the optimum number of people per toilet is, but the range is alarming.
There is of course the old problem that this may also partially highlight the variety in the information given by different councils either by FOI or website, i.e. what they consider a ‘public toilet’.
However there’s enough bright red to make me think something is going wrong in those areas, and it’s worth a closer, more local investigation. I suspect there are also more interesting datasets to map than population or area, but I’m not sure where to start. Please send suggestions!
You can play with the interactive version at http://cdb.io/1EeCMqg.
..”the 40% decline in the last 10 years”
This morning an email through a very active public toilets mailing-list led me to look at publications on ‘Age-Friendly Cities’. One report called The Alternative Age-friendly Handbook by the Manchester Institute for Collaborative Research on Ageing contained this strangely familiar statistic:

Screenshot from An Alternative Age-Friendly Handbook
The statistic implies a 40% reduction between 2004 – 2014. Yet this cannot be true, as the quote has been around for as long as I can remember.
So on what evidence is it based and to which 10 years does it refer?
The 2014 BBC News article cited in An Alternative Age-Friendly Handbook attributes it to the British Toilet Association (BTA).
Last year [2013] the British Toilet Association estimated that there has been a 40% drop in the number of public toilets across the UK in the last 10 years. (BBC News, 2014)
The BTA’s website doesn’t include a press release from 2013 to verify this. The BBC may be referring to the same quote given by the BTA on the Today programme in August 2013.
In fact the oldest BBC News article that uses this statistic is from 2007. This article seemed to imply it was from Help the Aged research (now AgeUK), and refers not to a 10-year period but is instead ‘since 2001’ which was when the Audit Commission stopped collecting data on the number of public toilets:
[Help the Aged] wants to see the reinstatement of a national mapping exercise to determine the level of provision which, until 2001, was undertaken by the Audit Commission.
It is estimated that since 2001 toilet provision has fallen by 40%. (BBC News, 2007)
However this also didn’t quite pan out when I looked at Help the Aged’s excellent 2007 research publication Nowhere to Go, to which the BBC News article was referring. Whilst the report mentions the statistic in its introduction, it is not a finding from their research but again attributed to the BTA:
Until 2001 the Audit Commission carried out surveys of Britain’s public toilet provision, which showed that it was declining rapidly. Since then a campaigning organisation, the British Toilet Association, has estimated that public toilet provision has dropped a further 40 per cent to less than one public toilet for every 10,000 people in the UK, not taking visitors and tourists into account. (Help the Aged, 2007)
Nowhere to Go does produce its own findings based on over 1000 survey respondents:
80 per cent of respondents do not find it easy to find a public toilet.
78 per cent of respondents found that their local public toilets are not open when they need them.
(Help the Aged, 2007)
The “40% reduction in public toilets..’ fact crops up again in 2007-08 in written evidence to parliament for the Communities and Local Government Select Committee report into The Provision of Public Toilets. Despite this being printed around the same time as Nowhere to Go, the statistic now doesn’t refer to a decline ‘since 2001’, but now states ‘..in the last 10 years’, suggesting a comparison with data from 97-98. Although it is still attributed to the BTA, it doesn’t actually feature in their own written evidence to parliament. Instead it is quoted in the written evidence of the British Standards Institution (BSI):
The BTA contended that over 40% of public toilets have been closed in the last 10 years. (British Standards Institution in The Provision of Public Toilets, 2007-08)
It also features in the BTA’s written submission to the London Assembly for their 2011 update report Public Toilets in London, but without an implied time period and emphasising the lack of data.
Has the number of publicly accessible toilets in London increased since 2006?
BTA: Despite the fact that the overall number of public toilets in the UK has declined in recent years by at least 40%, and the lack of reliable data makes it impossible to track the decline, the previous Labour Government failed to accept the Select Committee’s recommendation that ‘the Government seeks a means of collecting this data, either through requiring local authorities to provide figures from their own areas or by charging the Audit Commission with resuming its collection of accurate information on the provision of public toilets. We cannot therefore factually answer this question. (British Toilet Association in Evidence log – Public Toilets – Greater London Authority, 2011)
What’s interesting is that the London Assembly’s original 2006 report ‘An Urgent Need: The State of London’s Public Toilets’ also found a 40% decline, but this was specifically for London’s public toilets, saying that:
figures show an incredible 40 per cent decline in London’s public toilets since 1999. (London Assembly, 2006)
The London Assembly’s report explains how they arrived at this finding. The research compares ‘the last year for which the Audit Commission collected these statistics (1999/2000)’ which states 701 public conveniences produced by local authorities in London; with information from 2005 compiled as a response to a parliamentary question put to the Deputy Prime Minister, recorded in Hansard, which states 419 public toilets in London. This figure comes from an analysis of provisional industry and commercial data held by the Valuation Office Agency (VOA), and represents the number of toilets in London for the last year for which they had data – 2004.
Whilst the London Assembly acknowledge that this is not comparing identical sources of data, they conclude that this represents a decline of 40% in the number of public toilets in London in just 5 years.
Hansard gives 5 years worth of public toilet data from the VOA, from 2000-2004. The data from 2000 estimates 500 public toilets in London for almost the same time period as the Audit Commission that estimated 701 public toilets. By the same logic, this would imply either a 30% reduction in toilets in London within one year (2000) OR more obviously, that the two organisations are using different definitions of ‘local authority public toilets’. A comparison between these two different data sources cannot be used to ascertain a decline over a period of time.
The GLA do go on to compare like-for-like, emphasising that the difference in the Valuation Office Agency figures from 2000 (500 toilets) to 2004 (419 toilets) still represents a significant 16.2% reduction in London’s public toilets in 4 years, and the largest for any region, thought significantly less than 40%. It’s also larger than the overall reduction in toilets for England (9.2% reduction) and more than double that for Wales (7.9% reduction).
This table shows data for the whole of England and some for Wales (but notably, not the whole UK) from the Valuation Office Agency as printed in Hansard, and Audit Commission data from both 1999-2000 and 2000-01 (it’s not clear why the GLA say 1999-2000 is the last year for which the Audit Commission has data – the latter showed 654 toilets for London)

Number of local authority public toilets
Comparing the Audit Commission data with Valuation Office Agency data for the whole of England for these years shows again how the latter produces a consistently lower number of public toilets. It also shows an overall decline of about 10% between 2000-2004 across England, however this time period is now over 10 years ago, so we cannot assume this has continued.The Valuation Office Agency continue to hold data on public conveniences which could be used to ascertain a % reduction in traditional public toilets in England and Wales. Their website allows you to search their 2010 database for the rateable value of property, but not to download open data of all properties of a type – say – public conveniences. Someone did send me such a file in 2012 showing 4626 toilets, however I don’t know how this was generated, for which year it is, or whether I’m even meant to have it! It does seem that these older stats are free-standing toilet blocks and so would be difficult to compare to the modern public service which encompasses toilets in other buildings such as shopping centres, public buildings or community toilet schemes.
My own count of public toilets is based on another methodology – toilets listed on council websites – and found 3447 public toilets in England in 2013 (excluding community toilet schemes). This could confirm a continued decline.. or it might just reveal how incomplete council websites are (a minority have no information on toilets at all).
Whilst I’ve not found the original research that found a 40% decline in public toilets for the UK over a 10 year period, the statistic dates from at least 2007, making it 8 years out-of-date and widely misrepresented.
The fact that BBC News articles and research publications continue to print it illustrates the complete dearth of more recent toilet data.
That might gradually change if more councils choose the publish public toilet open data. However what does it say abot the lack of attention given to public toilets – a service at risk from local government cuts because councils don’t have to provide them – when we don’t even know the extent of the current service?
..the public need
Since launching The Great British Public Toilet Map, we’ve had lots of lovely comments from people who think it’s a great idea and who took the time to tell us. The majority have been from people for whom finding a toilet is a serious concern due to medical conditions or medication.
Here is a collection from emails to toiletmap@rca.ac.uk, Twitter and the comment feed of The Guardian article that give first-hand insights into the importance of better toilet information to the general public.
Great idea. As someone who works outside all day a toilet stop is part of the normal routine
On behalf of all men with prostate problems – thank you.
This is much needed for Ulcerative Colitis and Crohns sufferers. It would be great to have an app so you aren’t reliant on mobile internet signal when you urgently need to go!
The Great British Public Toilet Map is genius and will take all the stress from my holiday in Scotland next month. Thank you.
This is a great idea, especially if, like me, you suffer from prostate cancer.
As someone with an ultra-sensitive bladder, I just wanted to say THANK YOU!!!!!!!!!! What a brilliant idea!
At long last an app/map that is REALLY useful, if only something like this had been available when my late father was alive, what a Godsend it would have been on days out when the first thing we had to find was the toilets!!
@GBToiletMap ‘s brilliant map shows you where you can find public toilets and lists whether they are accessible and whether they are gendered
Thank you so much for whoever came up with this idea. I do hope plenty of other people e-mail you with thanks and a hope that this app is available for long time – as you say with an aging population it will be a winner.
Hi, a great project as a Crohns sufferer it can be a nightmare getting caught short and always thinking about it when your out!!
It would be an amazing app on a phone, not only for people like me but also as a parent, often kids can’t wait and the disapproving looks I get when my little boy goes in the bushes??
It’s so important. I’m neither old nor unfortunate enough to suffer from a bladder or bowel condition, if I’m out for more than a couple of hours when on my period I absolutely need to find somewhere. The worst is always a long train journey when the toilets are out of order. I suspect a lot of women read this article and had the same thought.
I’ve suffered from Crohn’s Disease for the last 5 and a half years, so it’s fantastic to see a map like this become a reality, as it certainly makes visiting new places a heck of a lot less daunting. It’s especially important as public toilets are being closed left, right and centre, and many businesses are not always particularly welcoming to those in my situation!
.. The Great British Public Toilet Map
The Great British Public Toilet Map launched last Wednesday 19th November on World Toilet Day*

Previous versions of the map have existed since 2011, but this is now the largest publicly accessible toilet database in the UK by some way. It has over 9500 toilets, and I’d be confident of saying that the map will help you to find toilets no matter where you live.
If for some inexplicable reason it doesn’t, you can add, edit and remove toilets until it does! We’ve had over 1000 toilets added this week.
There are also a tiny minority of locations where the data has gone a bit loopy with duplicate loos or inaccurate locations. Don’t be shy about removing those that you think are wrong, or telling us at toiletmap@rca.ac.uk about parts of the country that may need a little attention. You’ll be doing us a huge favour.
You can read more about the map in The Mirror, The Guardian or The Telegraph. Or view our press release.
*As well as World Toilet Day, it was also GIS Day (Geographic Information System). They might as well name it Toilet Map Day.
…Transport for London
The toilet data deluge continues..

Now it’s Transport for London’s turn, who are providing open data about toilet facilities on their network, spotted and shared with me by @OwenBoswarva on Twitter.
I don’t pretend to understand these things entirely, but it looks like two separate datasets:
- .xml called ‘Step-free Tube guide and Toilet data‘ professing to have toilet info for all Tube, Overground and DLR stations
- .csv for Toilets in Bus Stations
This delivers on one of the Mayor’s earlier commitments; that TfL would publish their Under-, Over-, Tube and Bus station toilet data by Spring 2012; in response to the London Assembly’s 2011 report into London’s public toilets.
Thank you Transport for London! Unlike a toilet, it’s better late than never.
.. Ordnance Survey – Part IV
It never rains but it pours..

A screenshot of the OS OpenData map product.. which doesn’t show toilets.. but who knows what the future may bring?
I’m still catching up on everything that’s happened in the past year, but it seems that Ordnance Survey are opening up their toilet data!
Or to be very, very, specific..
“..recently we have enabled our IP to be used in an open data release of one council’s toilet data, and if any others approach us for releasing toilet data this is likely to be on the same terms”
The council was the Borough of Barrow-in-Furness, who applied for a OS derived data exemption, in order to produce their toilet data for the LGA’s incentive scheme.
It’s great that OS have recognised that open toilet data is in the public interest and personally I think they deserve a really big hug.
Past posts on the OS saga: